Understanding Your Browser Fingerprint, Or, a Basic Introduction to Information Theory
In my previous post, I wrote about browser fingerprinting in a general way. This is an exploration of the math involved with determining uniqueness of a fingerprint. I initially took notes while reading Panopticlick’s excellent paper, and this is the result of that. Feel free to ignore this if you don’t want a deep dive.

In a fingerprint, some values hold more information than others. Let’s take a look at what we care about in a fingerprint.
Information
Each piece of a fingerprint contains a certain amount of information.
Does a User Have Javascript?
(T/F): 1 bit of information
This is a boolean value, and therefore has one bit of information. It can be zero (false), or one (true).
User Agent
A variable length string: many bits of information
If my Chrome user agent is: Mozilla/5.0 (Macintosh; Intel Mac OS X 10_15_4) AppleWebKit/537.36 (KHTML, like Gecko) Chrome/81.0.4044.138 Safari/537.36, this has 121 characters. In ASCII, each character is a 8 bits, or a byte (an interesting aside, ascii only needs seven bits, but eight is used as a standard). Therefore, the total information for my Chrome browser is (121 * 8 =) 968 bits.
However, although there is almost a KB of information, not all of it helps to uniquely identify you. My user agent on another machine is Mozilla/5.0 (X11; CrOS armv7l 12871.91.0) AppleWebKit/537.36 (KHTML, like Gecko) Chrome/81.0.4044.127 Safari/537.36. Much of this string is the same as above. We only care about the information that makes you stand out from the crowd.
Surprisal
It took me a while to understand this concept. I thought it meant “A given browser has a percent chance of not being the expected value. The surprisal is the percent chance.” Not exactly. It is a measurement of uniqueness. What it actually means is “The more surprisal a browser fingerprint has, the more likely it is to be distinguished from other browsers.” It is not a percent, but instead a value that can go up to infinity.
We will measure surprisal in bits. Computers measure everything with bits (though that is only partly the reason they are used here). The information collected in a given fingerprint can be measured with bits.
Surprisal can be thought of as an amount of information about the identity of the object that is being fingerprinted, where each bit of information cuts the number of possibilities in half. – Panopticlick
A bit of math
Suppose that we have a browser fingerprinting algorithm F(·), such that when new browser installations x come into being, the outputs of F(x) upon them follow a discrete probability density function P(fn), n∈[0,1, .., N]. Recall that the “self-information” or “surprisal” of a particular output from the algorithm is given by:
 |
|---|
| Equation for Surprisal/Information Content |
The surprisal function looks a bit weird (with a negative sign). However, remember that probabilities are <= 1. Therefore, the log of a probability will be negative, so surprisal is >= 0. The slope steepens as X approaches zero (from the right), increasing towards infinity as it does. If the probability of the function is P(f) = 1/2, then the surprisal will equal 1. If P(f) = 1/4, I(f) = 2, if P(f) = 1/8, I(f) = 3, and so on.
 |
|---|
| For our purposes, we only care about the values between 0 and 1 |
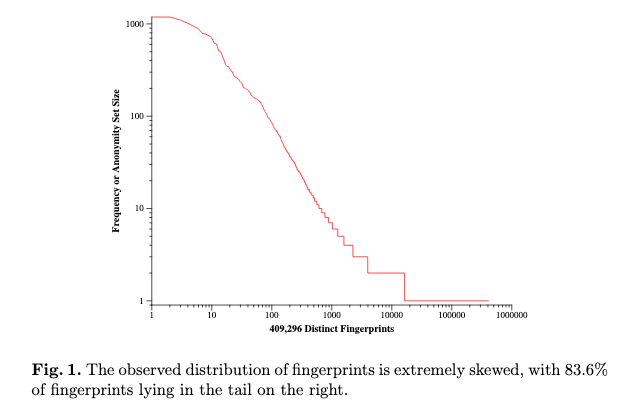
The paper states that ~84% of the browsers had unique fingerprints. There were a total of 470,161 samples taken. Let’s say that each unique instance has probability P(f) ~ 1/470161, and therefore has ~ 19 bits of surprisal.
 |
|---|
| Taken from the Panopticlick paper: most browsers are uniquely identified |
If we look at the above graph, the most common fingerprint accounted for 1186 visitors. Each of these were different people, but their fingerprint was the same. The probability of that fingerprint was P(f) ~ 1186/470161, and it would have ~ 8.6 bits of surprisal.
Disclaimer: the probability P(f) is not exactly correct. They took > 400,000 fingerprints, but the probability of your fingerprint being unique could be much lower. Out of all people on earth, it is unlikely that every 1 in 400,000 has the same fingerprint. The probability of could also be a bit higher, since we are making a few assumptions here. The paper goes a bit more into this.
Some background
The concept of surprisal, or information content, as Wikipedia calls it, comes from a branch of mathematics called Information Theory. In 1948, Claude Shannon was working on a way to identify useful signals from surrounding noise. His method was to compare a given signal to the average of all signals. If something was close to average, it was probably uninteresting. The more distinctive a signal was, the more information value it had.
For instance, the knowledge that some particular number will not be the winning number of a lottery provides very little information, because any particular chosen number will almost certainly not win. However, knowledge that a particular number will win a lottery has high value because it communicates the outcome of a very low probability event. – Wikipedia
With 19 bits of surprisal, these unique fingerprints communicate a lot of information.
Surprisal of Individual Fingerprint Features
We took a look at some examples of surprisal for an entire fingerprint, now let’s take a look at surprisal for some of the pieces that make up the fingerprint. The paper does not give all of the data here, but they do give the entropy for many of the values.
 |
|---|
| Entropy is just the average of the surprisals |
Does a User Have Javascript?
Disclaimer: The paper does not supply their full data, so I tried to infer based on their anonymity sets.
There are two equal options: this is a boolean. There are also two options for surprisal, but they may not be equal!
- Users without javascript: ~11,000
- Users with javascript: ~459,000
Therefore, the surprisal of each is:
- I(no JS): ~5.42 bits
- I(has JS): ~0.03 bits
Even though they both convey the same amount of information, the surprisal is very different. If you do not have JS enabled, this will make you more identifiable relative to the crowd. We can also compare this to the entropy:
H(whether or not a user has JS enabled) = (11/470) * 5.42 + (459/470) * 0.03
H(JS) = 0.16 bits
Since the surprisal of no JS is significantly higher than entropy (the average), it is very useful relative to the crowd. The opposite is not at all useful relative to the average.
The interesting thing about Javascript is that it will have an effect on later values.
User Agent
In Appendix A of the paper, it states that the entropy of the user agent is 10 bits (the entropy is the average surprisal). Although a user agent may have 900+ bits of information (the one from Chrome above had 968), the difference between user agents is much less. User agents that have a surprisal above 10 bits will convey more unique information about the user.
Plugins
Again from the paper: the entropy of plugins is 15 bits. We do not have the exact data for each user, but we can make an inference here. If the surprisal of your plugin list is greater than 15 bits, you deviate from the norm significantly. Conversely, if your surprisal is less, you will not stand out.
This links back to having JS enabled. Every user who disables JS will not show plugins. This means that ~11,000 users have the same value for plugins. This was a problem for showing JS when there were only two options, but now there are many more possible values for plugins. Looking at their example plugin list, there are well over 2000 characters for just one example! My plugins looks like this: "Chrome PDF Plugin; Portable Document Format; internal-pdf-viewer; ,Chrome PDF Viewer; ; mhjfbmdgcfjbbpaeojofohoefgiehjai; ,Native Client; ; internal-nacl-plugin; ". With so many different options for the plugins, this means that the probability of having no JS is actually relatively high. With a high probability relative to the average, the surprisal is low. If you have Javascript disabled, you will not stand out from the crowd (with respect to plugins).
We can infer the surprisal, of plugins, for users with no Javascript:
- Users without javascript: ~11,000
The surprisal, for plugins, for a user with no Javascript, will once again be ~5.42. That may seem high, but remember that the average surprisal is 15 bits. Lets imagine a user who has a unique list of plugins. They would have P(f) ~ 1/470161, and then have a surprisal of ~ 19 bits. Let’s compare the total surprisal for each user.
- I(has JS? | no Js) = 5.42 bits
-
I(plugins | no JS) = 5.42 bits
- I(has JS? | has JS) = 0.03 bits
- I(plugins | has JS) = 18.84 bits
Although the user without Javascript had a higher surprisal initially, their total surprisal will be much lower.
If a user has Javascript enabled, and they share their plugins with 127 other people, that user will still have a higher total surprisal.
Blocking JS makes you stand out for one feature, but will make you blend in with any feature that requires JS to find the values.
In conclusion
Math is hard.
Even though I made a few estimates from the data, we can still infer some interesting things.
Sending more information does not necessarily mean you stand out.
Values in a fingerprint are not independent.
Think about how you compare with the crowd. There are multiple crowds you can should consider.
Iffy Statistics
There are statisticians (and other amateurs) who are smarter than me, that may get angry at me. A few liberties were taken, and I wrote disclaimers about them. I think that my assumptions are within reason, and the conclusions I come to are also reasonable.
However, I may not have caught all of the assumptions. Feel free to let me know if there is anything I missed. You can open an issue on the Github for my blog.
Further Reading & Sources
- How Unique is Your Browser? - A whitepaper by EFF.
- Panopticlick - EFF will show your fingerprint to you
- Entropy and information content on Wikipedia